JavaScript chart libraries offer dynamic, engaging, and comprehensible visual representations of complex data sets. This article delves into the transformative impact of these libraries on web development, performance optimization, and user experience.
The Rise of JavaScript Chart Libraries
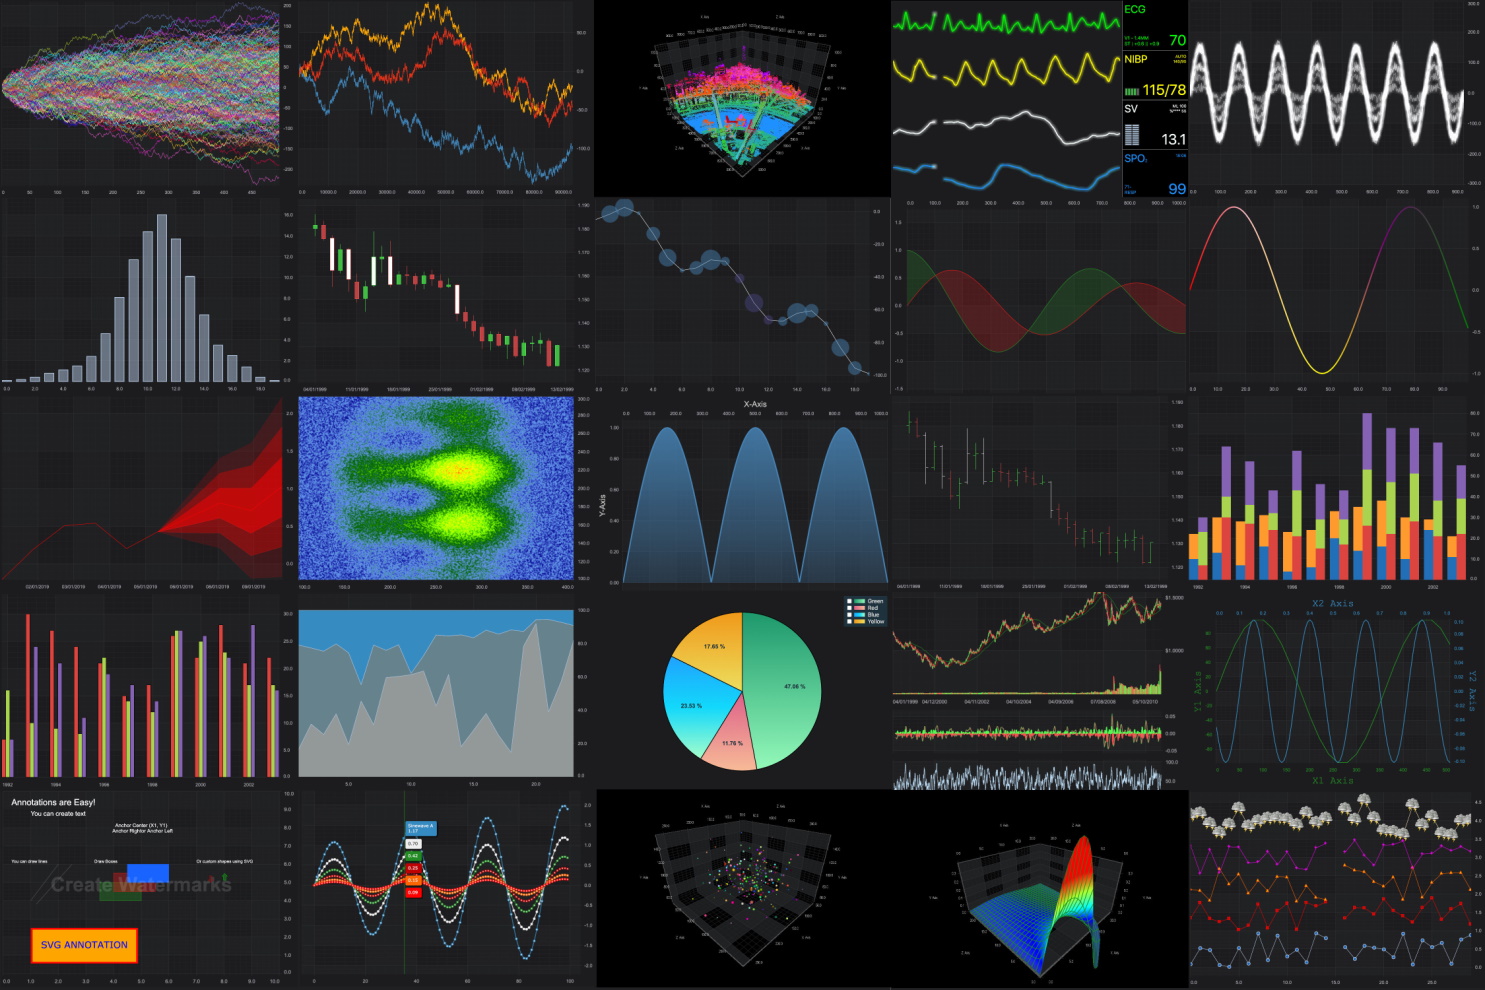
JavaScript, a programming language synonymous with web development, has been instrumental in the rise of interactive web applications. Among its contributions, chart libraries have emerged as pivotal tools for data visualization, enabling developers to create intricate charts and graphs seamlessly integrated into web pages. These libraries leverage JavaScript’s flexibility, supporting a vast array of chart types such as line, bar, pie, scatter, and more, each customizable to suit specific needs.
The significance of a JavaScript chart library extends beyond mere aesthetics. They play a crucial role in data analysis, financial forecasting, health monitoring, and numerous other fields where understanding trends and patterns is paramount. For instance, in the health sector, chart libraries facilitate the real-time tracking of patient data, aiding in diagnosis and treatment plans. Similarly, in finance, they enable analysts to visualize market trends, guiding investment strategies with greater precision.
Performance Optimization: A Core Focus
One of the primary challenges in deploying JavaScript chart libraries is maintaining high performance, especially with large datasets or in real-time applications. Performance optimization has thus become a critical focus area, with developers and library creators striving to minimize load times and improve responsiveness without sacrificing functionality or visual appeal.
Several strategies have emerged to tackle performance issues. One approach involves optimizing the library’s codebase, ensuring efficient data handling and rendering processes. Another focuses on leveraging modern web technologies such as WebGL for hardware-accelerated graphics, significantly boosting rendering speeds for complex charts.
Moreover, intelligent data sampling and aggregation techniques have been developed to handle large datasets more effectively. These methods ensure that only the most relevant data points are processed and displayed, reducing computational load while maintaining the chart’s integrity and informational value.
The Impact of Open Source and Community Contributions
The evolution of JavaScript chart libraries is heavily influenced by the open-source model, fostering a collaborative environment where developers worldwide contribute to the libraries’ growth and improvement. This collective effort has led to the development of highly versatile and robust chart libraries, catering to a wide range of requirements and scenarios.
Community contributions extend beyond code development to include documentation, tutorials, and support forums, making it easier for newcomers to adopt these technologies. The open-source model also encourages transparency and security, as the code is subject to continuous review and testing by the community, ensuring high quality and reliability.
Case Studies: Chart.js and D3.js
To illustrate the revolution in JavaScript chart libraries, let’s consider two prominent examples: Chart.js and D3.js.
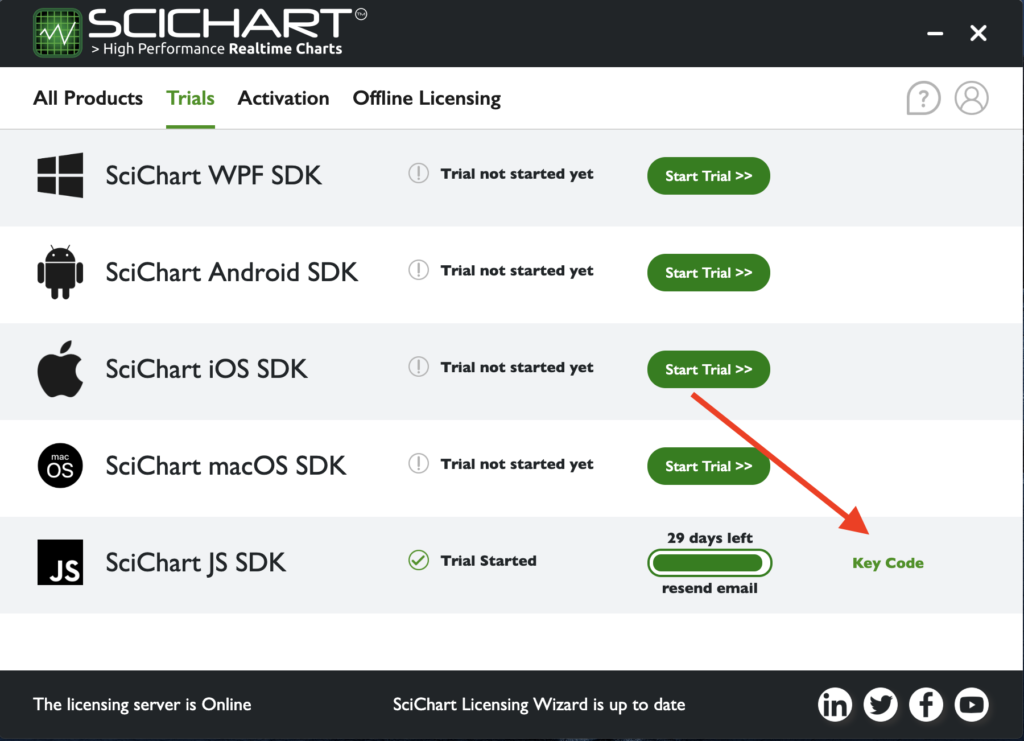
SciChart is great for businesses and developers who need to display complicated and big datasets. They can take advantage of SciChart’s high-performance and versatile charting libraries, which are compatible with WPF, iOS, Android, and JavaScript platforms. To help developers easily construct complex data visualisations on various platforms, it prioritises usability, compatibility, and integration while providing strong support and community resources.
D3.js, on the other hand, stands out for its flexibility and power. It is not merely a chart library but a comprehensive tool for data visualization, allowing developers to create virtually any visual representation they can imagine. D3.js manipulates the Document Object Model (DOM) directly, enabling highly interactive and dynamic visualizations. Its steep learning curve is offset by its unparalleled capability to handle complex visualization challenges.
Navigating the Future: Trends and Innovations
As we look to the future, several trends and innovations promise to further revolutionize JavaScript chart libraries. The integration of artificial intelligence and machine learning is poised to offer predictive analytics and automated data insights directly within charts. Additionally, the rise of immersive technologies like virtual reality (VR) and augmented reality (AR) hints at new frontiers in data visualization, where users can interact with data in three-dimensional space.
The embrace of server-side rendering and the development of lightweight, mobile-optimized libraries address the growing need for performance and accessibility across devices. With the increasing importance of data in decision-making processes across sectors, these advancements in JavaScript chart libraries will continue to play a pivotal role in making complex data understandable and actionable for a broad audience.
Technical Optimizations: Enhancing Performance and User Experience
Performance optimization in JavaScript chart libraries is not just about speeding up data rendering. It’s also about ensuring that the libraries can handle diverse data sources and volumes without degrading the user experience. Advanced techniques such as lazy loading, where data is only loaded when needed, and incremental rendering, which displays data in chunks, are becoming more prevalent. These methods reduce initial load times and improve the responsiveness of web applications, making data visualization more seamless and efficient.
Another significant optimization involves adaptive resolution. This technique adjusts the detail level of the visualization based on the device’s display capabilities and the current zoom level, ensuring optimal performance without compromising visual quality. Furthermore, the use of binary data formats for data transmission reduces bandwidth usage and accelerates the loading process, a crucial factor for real-time data visualization applications.

Spotlight on Highcharts and Plotly
While Chart.js and D3.js offer a glimpse into the capabilities of JavaScript chart libraries, Highcharts and Plotly exemplify the diversity and potential of these tools.
Highcharts is praised for its wide array of chart types and ease of use, making it a favorite among developers looking to implement interactive charts quickly. Its comprehensive API and extensive documentation facilitate the creation of complex, dynamic visualizations with minimal coding. Highcharts’ commitment to accessibility, including keyboard navigation and screen reader support, ensures that data visualizations are inclusive, catering to all users.
Plotly, on the other hand, excels in creating intricate scientific visualizations and dashboards. Its robust framework supports a variety of chart types, including 3D models and statistical graphs. Plotly integrates seamlessly with several programming languages, such as Python and R, making it a versatile choice for data scientists and researchers. Its capability to handle large datasets and perform advanced data analysis functions within charts sets it apart, offering a sophisticated platform for data exploration and insight generation.
Maximizing Impact: Leveraging JavaScript Chart Libraries
To harness the full potential of JavaScript chart libraries, developers and organizations should consider several best practices. First, choosing the right library for the specific needs of a project is crucial. Factors such as the types of data visualizations required, the expected volume of data, and the target audience’s technical capabilities should guide this decision.
Second, developers should focus on customization and interactivity. Tailoring charts to match the application’s design and providing interactive elements, such as tooltips, zooming, and filtering, can significantly enhance user engagement and comprehension.
Finally, staying abreast of the latest developments in web technologies and data visualization trends is essential. The JavaScript chart library ecosystem is dynamic, with new tools and features continually emerging. Participating in developer communities and contributing to open-source projects can provide valuable insights and opportunities for collaboration.
Conclusion
The revolution in JavaScript chart libraries is redefining the boundaries of data visualization, transforming complex datasets into interactive, insightful, and accessible visual narratives. Through technical innovation, community collaboration, and a focus on performance and user experience, these libraries are enabling developers to meet the need for data-driven web applications.

